tl;dr
Creatively visualising gpx data using simple, black-and-white visualisations created in R. The final output is then laser-engraved onto a photo album.
Memories and lasers
The premise for this small project is simple. Like many people I’m sure, my partner and I enjoy keeping photographic memories in photo albums; the covers of which we like to customise with laser-engraved designs. We recently spent an amazing holiday trekking across the Lake District over multiple days. As we hiked, marvelled at the beautiful landscapes and followed our OS Maps itineraries, we generated a bunch of gpx data.
Once I arrived back home, I wondered what pretty ways I could visualise this data to engrave our photo album. Naturally, as the colour options for a laser engraver are binary (either burnt-to-a-crisp or not-burnt-to-a-crisp), the main constraint I had for visualisation was to keep the colours I used binary (either black or white). I also tried to keep visuals as simple as possible.
Latitude and longitude, but elevated
The data that comes in a gpx format is relatively straightforward. Typically, the following are the variables that describe each point of a gpx track (an ordered list of points describing a path):
- Latitude
- Longitude
- Elevation (height above sea level)
- Time
For some reason, the gpx files I downloaded from OS Maps contained information on neither Elevation nor Time. As I was really keen to at least use Elevation data, this was a great opportunity for me to test out Jeffrey Hollister’s {elevatr} package. This is a package which, given latitude and longitude for a geographic point, draws on public APIs to return elevation data for that point. This worked like a charm and 9 lines of code later, I retrieved Elevation data for each of my points and was ready to start viz’ing!
Mapping out the route
The first type of data viz I experimented with was maps. Using National Park boundaries from the ONS Open Geography Portal, I wondered how the route we’d taken would look like within the boundaries of the Lake District National Park.
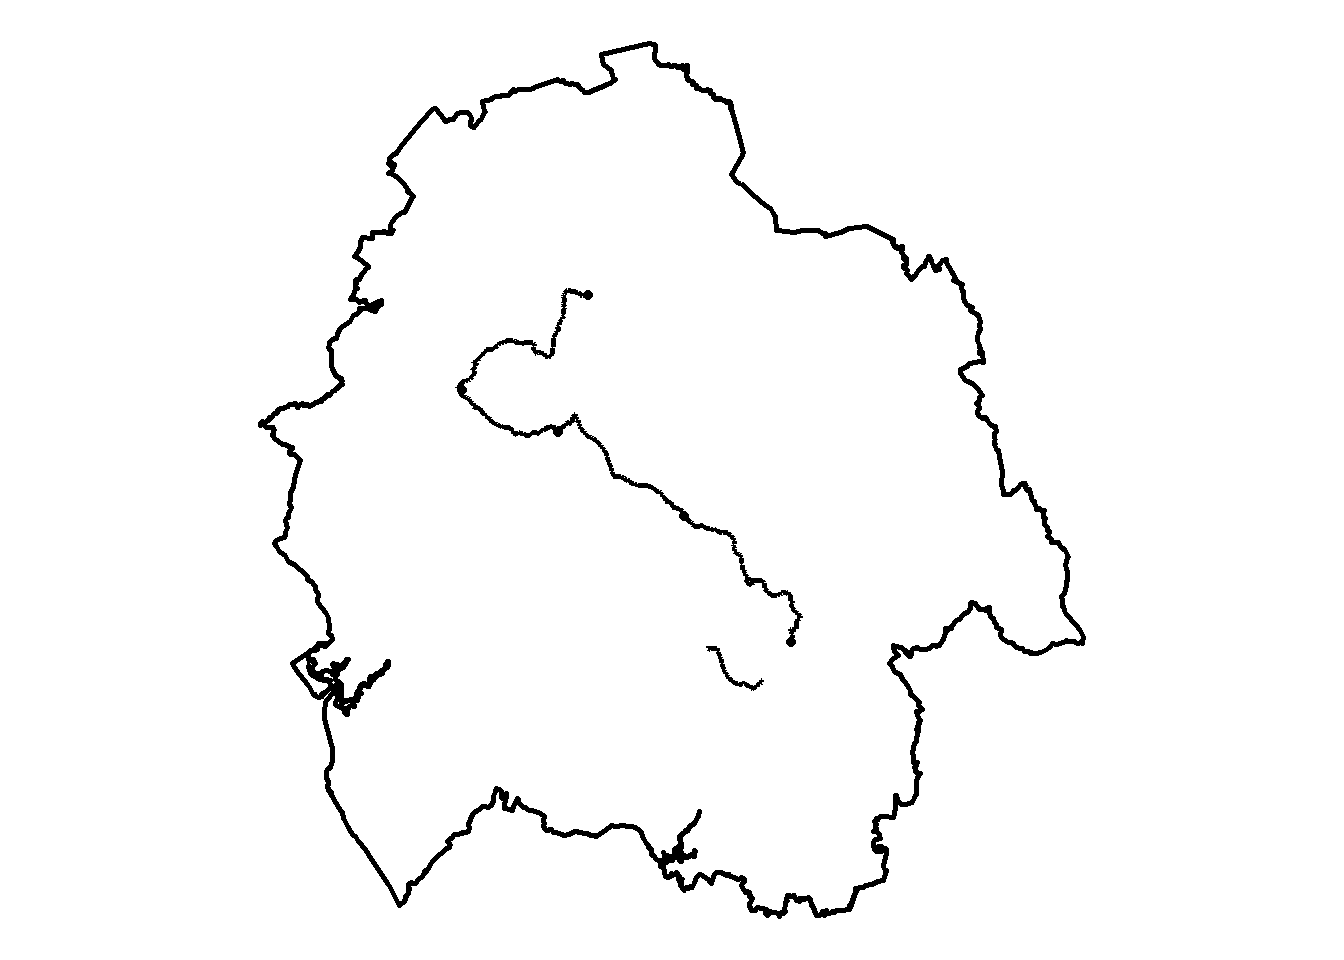
The result was okay, but not too visually appealing. I also reckoned some of the tricky Southwestern boundary details would not come out great after laser-engraving; so I moved on.
Making our ascent
I then decided to give the elevation data a go with some line charts. First, looking at the overall trek we did, showing each point in our journey on the x-axis and elevation on the y-axis…
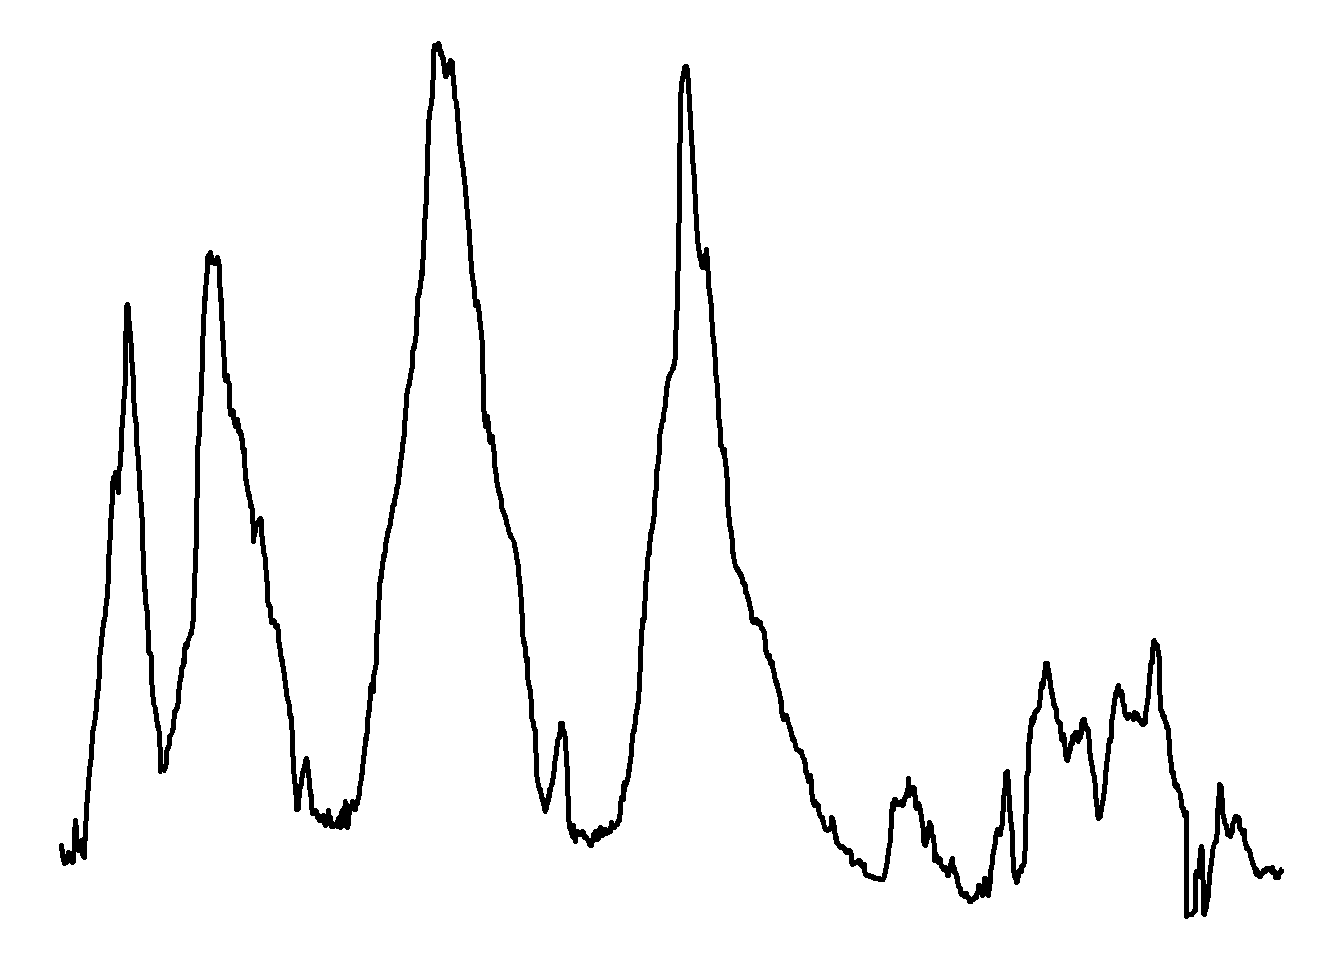
… then showing each day’s data as a separate line.
I quite liked the idea of visualising our trek as these overlaid ‘mountains’. However, there were two things I didn’t quite like in that last chart:
- Because we traveled more on some days than on others, each day’s line didn’t end in the same place.
- I thought it would look much nicer if the area under each line were filled in, to create some illusion of distance by having some ‘mountains’ appear in front of others.
So I scaled the x-axis as the percentage of the day’s journey (from 0% on the left to 100% on the right)…
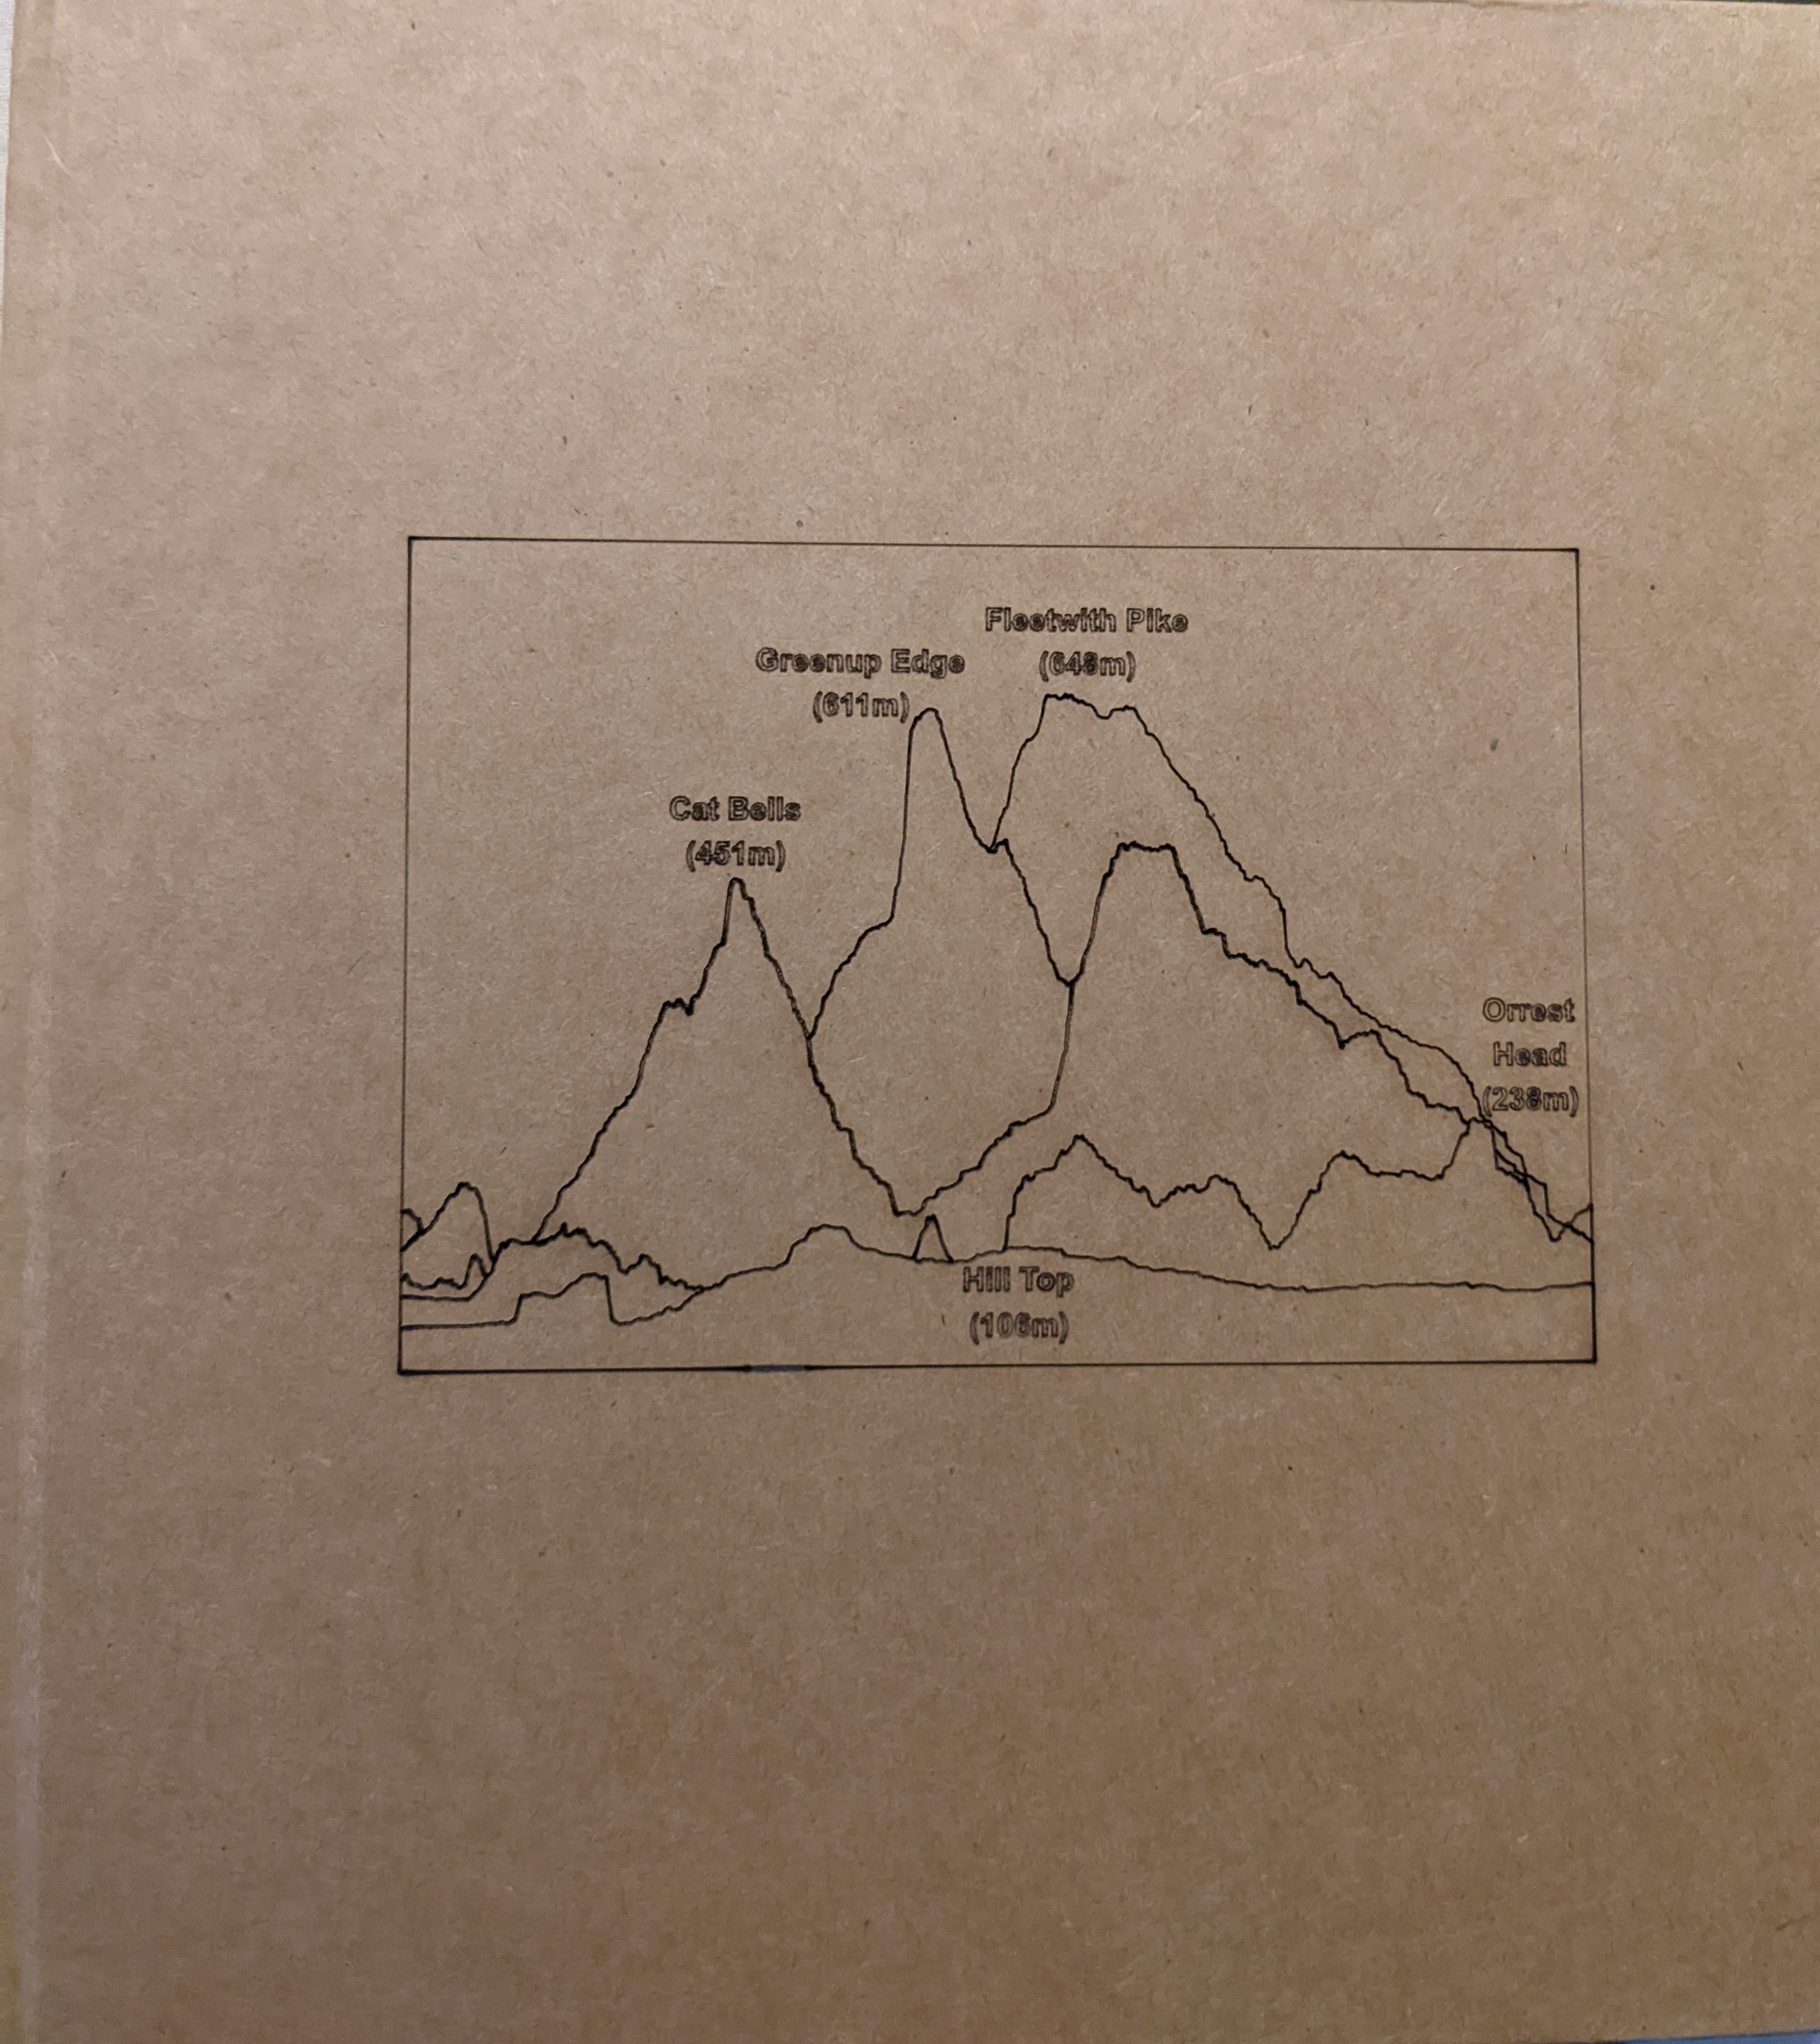
… then filled in the area under each line, keeping the larger ‘mountains’ in the back.
I was really pleased with this. I just completed the visual by adding a simple border frame and labels of each day’s highlight and called it a day!
Peak aesthetic
The final result looked like this.
All that was left was to send it off to the laser-engraver you saw in action at the top of this post and get it engraved onto our photo album. Thanks to Matt at the Swindon Makerspace for helping us with the laser!
Et Voilà!
Bonus shenanigans
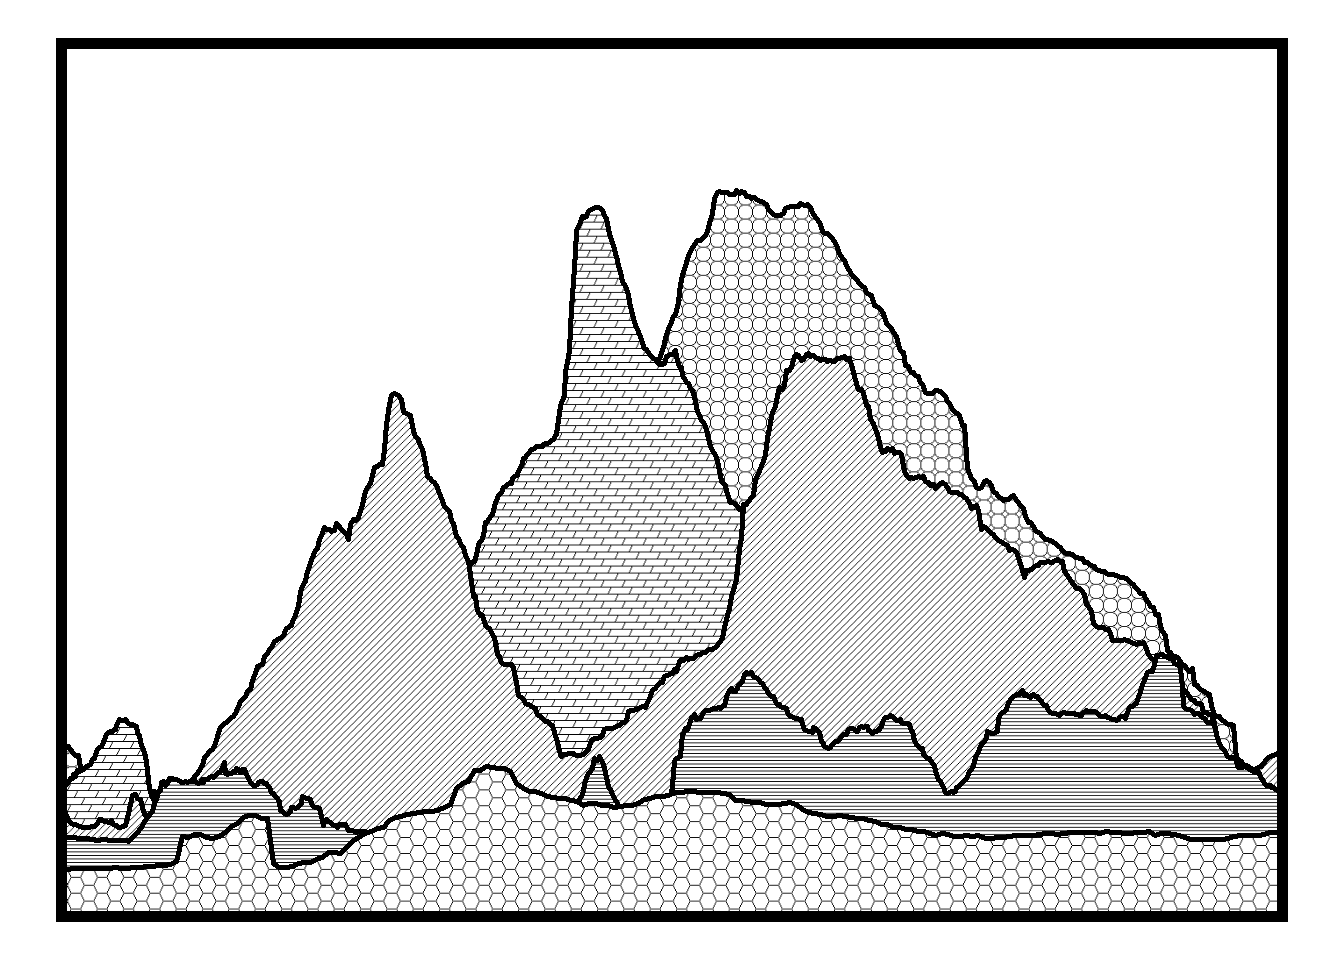
In the spirit of black-and-white data viz, I also played around with the {ggpattern} created by mikefc (aka coolbutuseless). This is a neat package which allows users to customise the way filled areas look using images or geometric patterns. I would think that one of its primary use case would be to help produce charts for books printed in black-and-white. My playaround led me to the chart below. Although the funky filled areas help to more clearly identify the separate hikes we did, they are definitely too visually complex for my laser-engraving use case!